
Recharging your Daily Commute
Note: These graphs were compiled from our data on March 23, 2010.
|
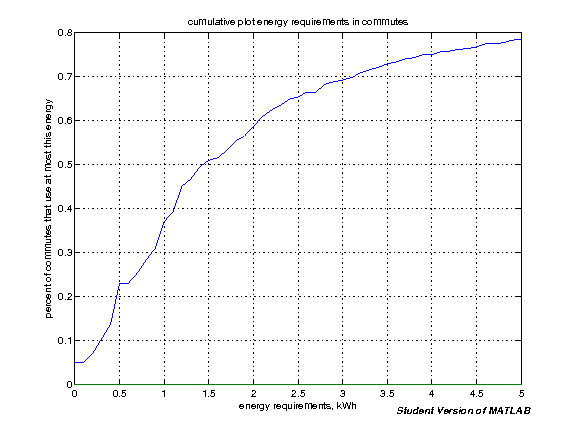
How much energy must be stored for a typical urban commute? Based on the data we have collected, it appears that more than half of all commutes in our database need less than 1.5 kiloWatt-hours, which can be stored in two typical car batteries. |
|
|
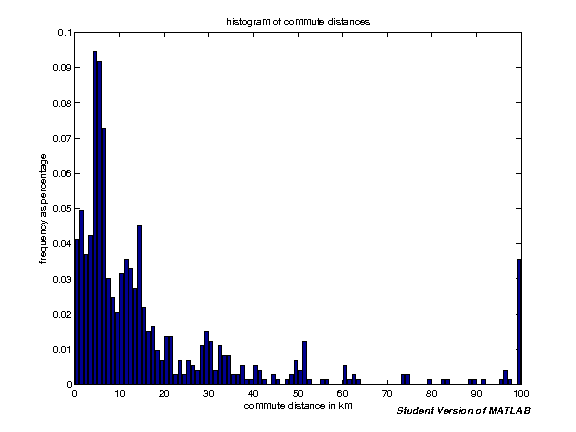
How far is a typical urban commute? Based on our data, it appears that the most frequent trip distance is 6 kilometers, though we can see that there are few other peaks at 15 and 30 kilometers. Based on this plot, we can also justify disregarding trip data for more than 100 kilometers, since those represent a very small fraction of the data we have collected. |
|
|
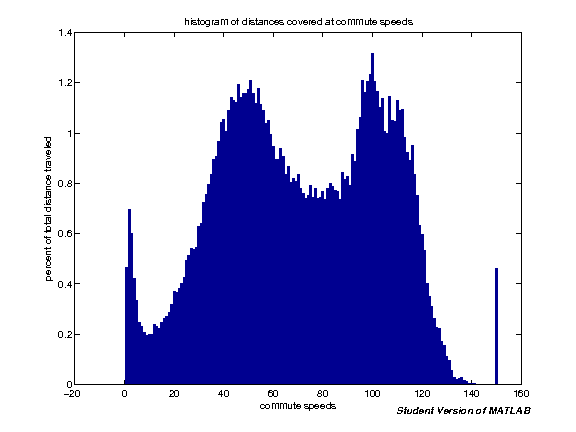
What are typical speeds for urban commuting? Using our data, we have plotted here a histogram of distance travelled at given speeds. The maximum is around 100 kph, but there are also peaks at 50 and 2 kph, which suggests a lot about urban driving habits. |
|
|
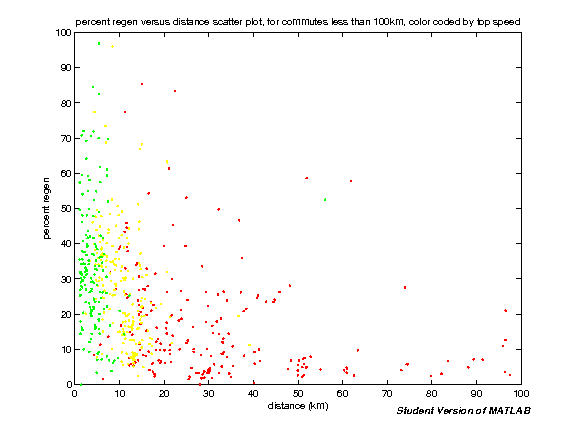
How much energy can be recovered from a typical urban commute? When a driver of an electric vehicle wants to slow down, she or he can either use mechanical braking as in a standard car, or use regenerative braking to capture some of the kinetic energy back from the vehicle. How much can really be recovered, though? Here we have plotted from our data energy recovery as a percentage of total energy consumed in a trip, as a scatter plot against commute distance. Green points have the lowest top speed, yellow intermediate, and red the highest. What can we learn about driver habits, and how they impact vehicle efficiency? What variables affect the amount of energy recovered during a drive? |
|
|
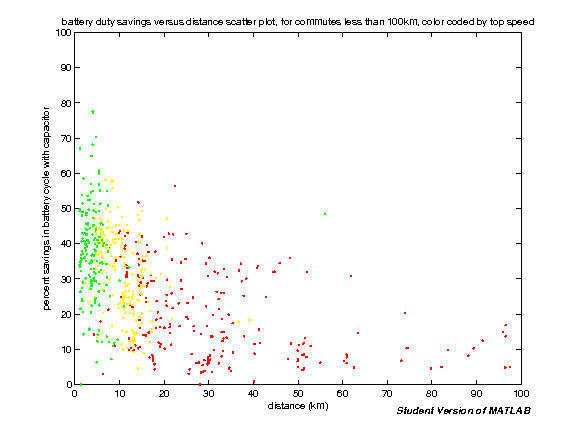
What impact does using an ultracapacitor have on the battery? One key technical contribution we are making is the use of an ultracapacitor in our vehicles, under the assumption that this will improve battery performance and longevity. Here we have plotted from our data what impact a capacitor and a naive managing algorithm will have on battery duty cycle, as a scatter plot against commute distance. As above, green points represent low-speed commutes, yellow medium-speed, and red high-speed. What can we say about the potential impact a capacitor can have on different styles of driving, and different types of commute? |
|
Back